The charts that show the state of the Covid-19 pandemic in Spain
From new infections to the positivity rate, there are a lot of numbers to keep track of when it comes to following the coronavirus.
These graphs and maps give you some of the most essential data for understanding how the pandemic is developing in Spain.
How many cases have been reported?
Spain was the first country in western Europe to reach one million confirmed cases, a grim milestone it reached earlier this month, although Pedro Sanchez said that in all likelihood more than 3 million Spaniards had actually been infected with Covid-19.
The current accumulative figure of confirmed cases in 1,136,503 as of data reported on October 28 of which 35,466 people died after testing positive to the virus.
Datos sobre #COVID19 en España, desde el primer caso inicial, actualizados a hoy 28 de octubre:
▶️por PCR: 1.136.503
▶️Fallecidos: 35.466
Información por CC.AA.: https://t.co/IyG3zTJeY8#NoLoTiresPorLaBorda#EstoNoEsUnJuego pic.twitter.com/IsqhJkTQKu
— Salud Pública (@SaludPublicaEs) October 28, 2020
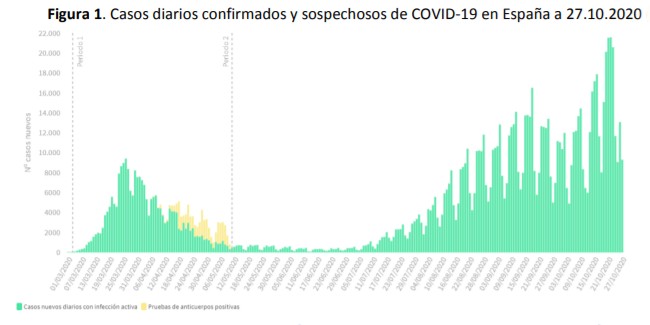
The average daily rise in confirmed cases aross Spain can be tracked on this graph below.
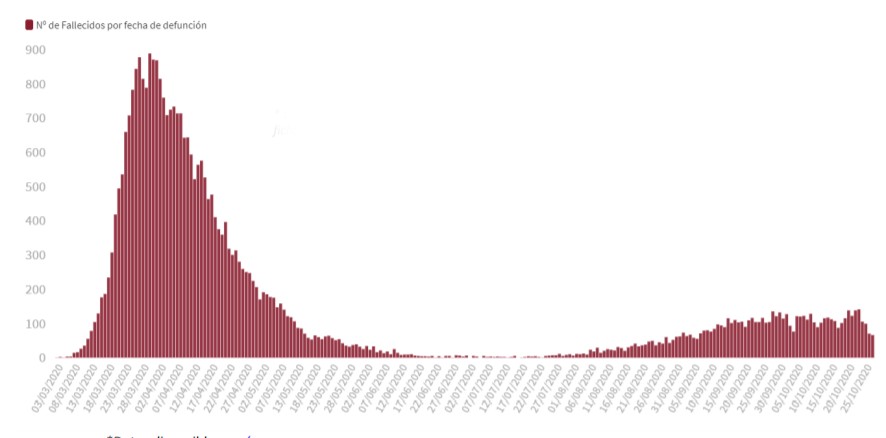
How many people are dying from coronavirus in Spain?
The total number of officially confirmed deaths from coronavirus in Spain since the start of the pandemic currently stands at 35,466 However, this figure only includes those cases which tested positive in tests and the true number is thought to be closer to 55,000.
According to released on Tuesday by Spain's health ministry, the number of deaths reported in the previous 24 hours stands at 267, although this is a new high in the second wave it is still a fry cry from the peak seen in the first wave when on April 3rd 950 deaths were recorded.
How many tests are being done?
Part of the reason so many new cases are being detected is that Spain has been increasing its testing capability and has now carried out 12.6 million PCR tests in total.
An average of 116,209 tests are now being performed per day across the whole of Spain, the most since the start of the pandemic.
This graph shows how testing has increased since the start of April when testing was extended beyond those being treated in hospital for suspected Covid-19:
These four charts below effectively show the surge in the number of cases diagnosed, hospitalizations and those requiring ICU treatment, and deaths since the end of lockdown in Spain week by week.
Week by week numbers are worth comparing with 75,188 in the week ending October 28th, compared to 64,272 in the week ending September 22nd compared to 40,427 cases for the week ending 24th August, a month earlier.
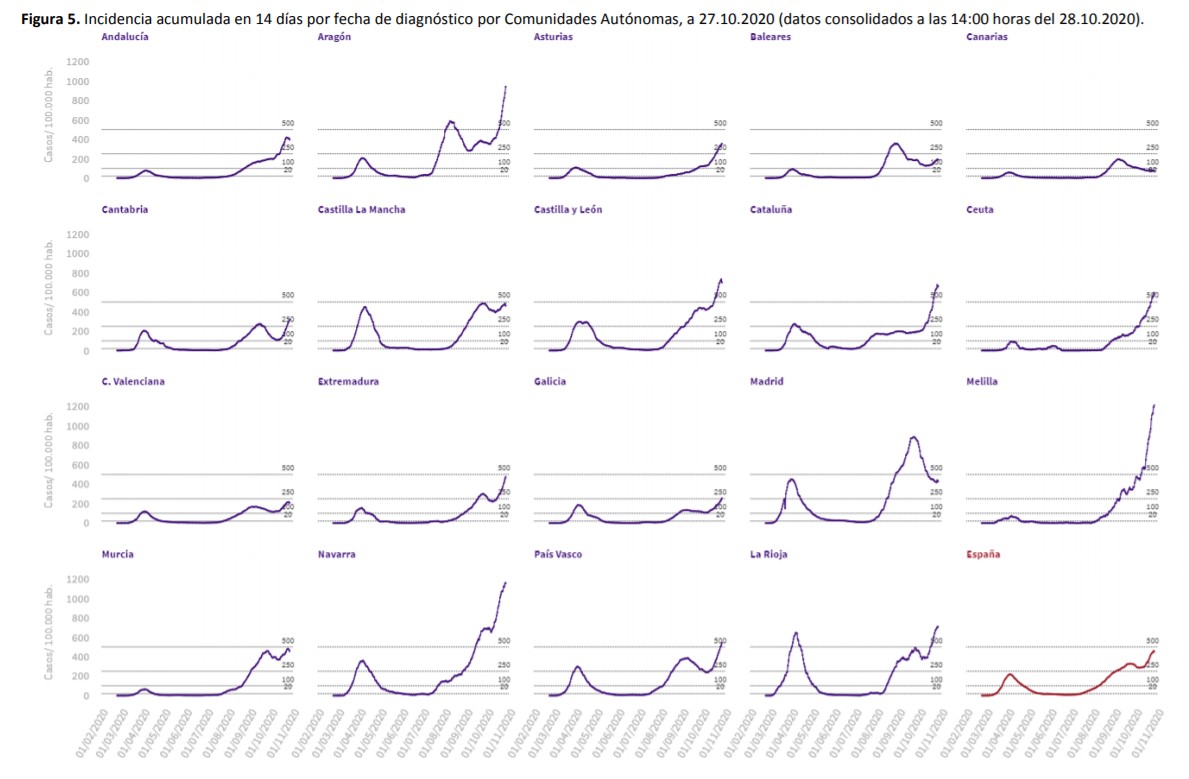
The 14-day cumulative number of cases per 100,000 inhabitants in Spain now stands at 436.47, the second highest in the EU after France with 680.6 cases per 100,000 inhabitants.
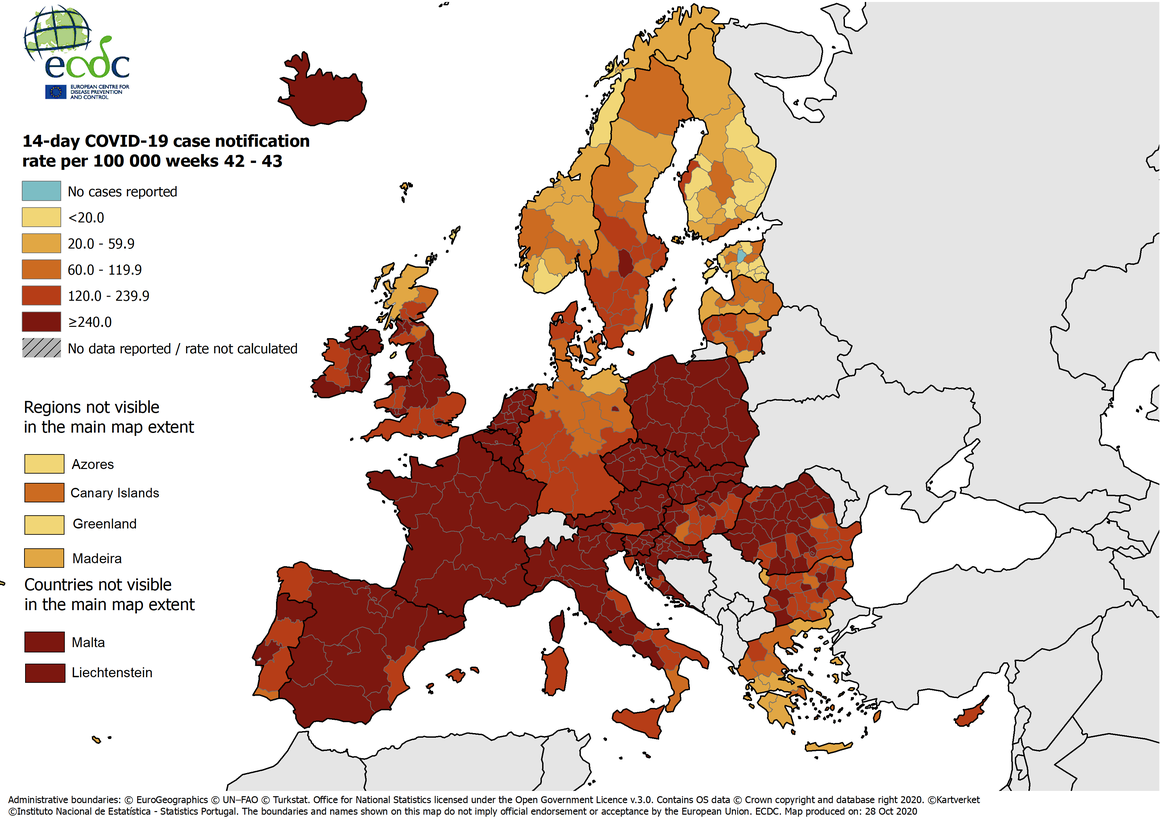
But the accumulative incident rate differs from region to region as these charts below show. They illustrate how some have been able to stem infections with recent measures while others are seeing infection rate rise.
This map produced by ElDiario allows you to check the cumulative incidence rate per municipality based on the epidemiological data produced by regional health authorities.
Hemos actualizado nuestro mapa de contagios municipio a municipio con los últimos datos: Salamanca, Granada, Pamplona, Melilla y Burgos están ya por encima de los mil casos por cada 100.000 habitantes en las últimas dos semanas https://t.co/0YKDhRsNaL pic.twitter.com/Ie1XZ0OC5J
— elDiario.es (@eldiarioes) October 28, 2020
READ ALSO:
-
Most of Spain's regions to close borders ahead of long weekend to halt Covid-19 spread
-
MAP:These are the regions of Spain with closed borders
-
MAP: These are the curfew hours across Spain
Comments
See Also
These graphs and maps give you some of the most essential data for understanding how the pandemic is developing in Spain.
How many cases have been reported?
Spain was the first country in western Europe to reach one million confirmed cases, a grim milestone it reached earlier this month, although Pedro Sanchez said that in all likelihood more than 3 million Spaniards had actually been infected with Covid-19.
The current accumulative figure of confirmed cases in 1,136,503 as of data reported on October 28 of which 35,466 people died after testing positive to the virus.
Datos sobre #COVID19 en España, desde el primer caso inicial, actualizados a hoy 28 de octubre:
— Salud Pública (@SaludPublicaEs) October 28, 2020
▶️por PCR: 1.136.503
▶️Fallecidos: 35.466
Información por CC.AA.: https://t.co/IyG3zTJeY8#NoLoTiresPorLaBorda#EstoNoEsUnJuego pic.twitter.com/IsqhJkTQKu
The average daily rise in confirmed cases aross Spain can be tracked on this graph below.
How many people are dying from coronavirus in Spain?
The total number of officially confirmed deaths from coronavirus in Spain since the start of the pandemic currently stands at 35,466 However, this figure only includes those cases which tested positive in tests and the true number is thought to be closer to 55,000.
According to released on Tuesday by Spain's health ministry, the number of deaths reported in the previous 24 hours stands at 267, although this is a new high in the second wave it is still a fry cry from the peak seen in the first wave when on April 3rd 950 deaths were recorded.
How many tests are being done?
Part of the reason so many new cases are being detected is that Spain has been increasing its testing capability and has now carried out 12.6 million PCR tests in total.
An average of 116,209 tests are now being performed per day across the whole of Spain, the most since the start of the pandemic.

This graph shows how testing has increased since the start of April when testing was extended beyond those being treated in hospital for suspected Covid-19:
These four charts below effectively show the surge in the number of cases diagnosed, hospitalizations and those requiring ICU treatment, and deaths since the end of lockdown in Spain week by week.
Week by week numbers are worth comparing with 75,188 in the week ending October 28th, compared to 64,272 in the week ending September 22nd compared to 40,427 cases for the week ending 24th August, a month earlier.
The 14-day cumulative number of cases per 100,000 inhabitants in Spain now stands at 436.47, the second highest in the EU after France with 680.6 cases per 100,000 inhabitants.
But the accumulative incident rate differs from region to region as these charts below show. They illustrate how some have been able to stem infections with recent measures while others are seeing infection rate rise.
This map produced by ElDiario allows you to check the cumulative incidence rate per municipality based on the epidemiological data produced by regional health authorities.
Hemos actualizado nuestro mapa de contagios municipio a municipio con los últimos datos: Salamanca, Granada, Pamplona, Melilla y Burgos están ya por encima de los mil casos por cada 100.000 habitantes en las últimas dos semanas https://t.co/0YKDhRsNaL pic.twitter.com/Ie1XZ0OC5J
— elDiario.es (@eldiarioes) October 28, 2020
READ ALSO:
- Most of Spain's regions to close borders ahead of long weekend to halt Covid-19 spread
- MAP:These are the regions of Spain with closed borders
- MAP: These are the curfew hours across Spain
Join the conversation in our comments section below. Share your own views and experience and if you have a question or suggestion for our journalists then email us at [email protected].
Please keep comments civil, constructive and on topic – and make sure to read our terms of use before getting involved.
Please log in here to leave a comment.